Are High Temperature Records Becoming More frequent?
23 July 2012
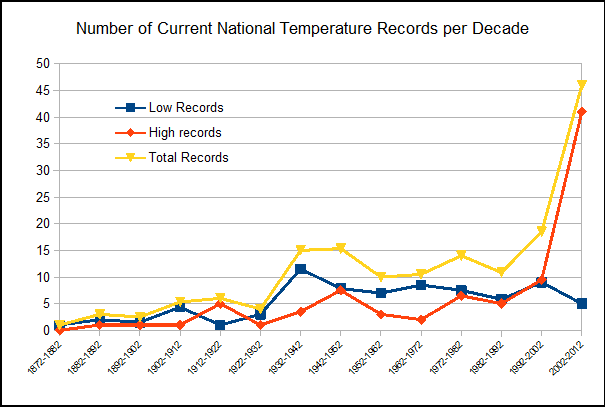
I have recently compiled a list of national temperature records by decade*
One has to be particularly careful when attempting to interpret this data since a record in one decade means that previous records would be ignored. Interpretation of trends or differences can therefore be misleading since a low number of records attributed to a particular decade might not be due to less records being set at the time, but more records being superseded in subsequent decades. This explains why in the first graph the low temperature records exceed the high temperature records in earlier decades.
If climate wasn't changing we should expect the same chance of setting a current record in any particular decade. However, this assumes the data is consistent and complete. If the number of monitoring locations increased throughout the period, which seems likely, this increases the chance of measuring a record. However, the ratio of high to low records would be less sensitive to these changes since both high and low temperature records should be reduced.
Another problem, is that many earlier temperature measurements may not conform to the same standards as the later ones, leading to further inconsistencies. This is probably more of a problem with older records, although heat island effects could be a factor in more modern measurements.
There is considerable chance variation due to the limited number of national records actually set in many individual decades. Hence in the second graph the data is amalgamated into four groupings 1872-1932, 1932 -1992, 1992-2002 and 2002-2012, so there are sufficient records in each category to be meaningful.
Since these are national records, each of these account for vastly different areas of the earths surface, therefore we might consider Russia to be more important than England for example. Possibly a better method would be to weight the records in terms of the countries area.
Subject to these caveats, if the climate was warming without exhibiting any increase in short term temperature variability we would expect a greater number of high temperature records and a lesser number of low temperature records in later decades, and vice versa if it was cooling. However, if temperatures were becoming more variable as well, the number of cold temperature records might remain.
Both graphs strongly suggest there has been a marked increase in high temperature records and in the ratio of high to low temperature records in more recent decades, and particularly during the latest decade. It is less clear if cold records have statistically decreased.
Since a far higher number of high temperature records appears to have been broken during the latest decade relative to previous decades, this challenges claims that the climate hasn't substantially changed in more recent years. It remains unclear to what extent increases in average temperature rather than extremes in temperature is responsible for this.
* Decades in which a record has been equalled is counted as a fraction to avoid multiple counting.


Environmental Transport Systems
Alternative Transportation Solutions through
Integrated Strategies and Technologies